RedHotDataProject
This page hosts our final project for the Applied Data Analysis course of the EPFL.

Introduction
As we are writing this data story, the 24th UN Climate Change Conference in Katowice comes to an end. After two weeks of intense and heated discussions between member nations, a long overdue agreement was reached on how to implement cuts to global greenhouse gas emissions. The problem of global warming sometimes seems just overwhelming and out of our individual hands. But is it really the case? We strongly believe that each of us can play a part on this effort. With this journey, we want to explore what possibilities we, as a consumer, are presented with to limit our environmental impact. This story is centred on our eating habits, as we have all heard that a lot can be done by changing them. We want to leave out clues as to how optimise our food consumption to limit the damage our culture risk inflecting on the World.
Before the Story, the Cleaning …
Our journey starts with a dataset, the crowdsourced
Open Food Facts dataset. This source of information is quite rich, with more than 710 000 food items sold in supermarkets all over the world, but, unfortunately, also suffers from heterogeneity, missing entries, a multitude of languages used and an absence or lack of standardisation for certain columns. After cleansing, translating and harmonising the data, we observe, for example, that about 40 000 products are sold in France.
However, the database is still very sparse on carbon footprints and needs the further enrichment provided by a sample of 663 additional products from the
Eaternity database that was offered to us by Manuel Klarmann, founder & CEO of the eponym project. We deeply thank him for this contribution to our project.
Another way to complement our sparse dataset consists in scraping from the web. We indeed harvested information about the product prices thanks to dedicated web crawler spanning the sites of Amazon, Monoprix, Migros, Kaufland, Cora, Coop and Walmart, as well as product categories for the Eaternity database from Codecheck.
Thanks to these cleansing steps, we gathered a modified version of the Open Food Database that is suitable to the task we set out to achieve.
Producing and Manufacturing Our Food
Our first query, equipped with our brand new database, is to explore the distribution of the products information over the world. But do we have access to a truthful represention of the information over the entire world? Let's investigate by plotting the purchasing places of our dataset.
Note how we mainly have data for "western" countries, with a huge bias toward France. We mostly lack information for countries in Africa, the Middle East and the centre of Asia. Our dataset is thus clearly not a truthful representation of the world. We shall therefore restrict the analysis to the case of France, since it is the most prevalent among the different columns. This means products are to be limited to those available for purchasing in France. This requirement is not an exclusive one: we do not only require them to be sold in France but to be at least available in France.
With these changes brought about, what can we say about the origin countries?
And the manufacturing countries?
Interestingly, the distribution only seems to change for the developing world! Indeed, these tend to rather be exporting products of origin instead of manufactured ones. On the contrary, developed countries contribute in the exports of both types of categories. This is of course not a surprising fact: developed countries are industrial powerhouses.
Now that this restriction in the representation power of our database is established, let us attack the first part of the problem: palm oil in the food industry.
The Palm Oil Connection
The
damaging effect of the over-production of palm oil is a well-known issue popularised in the beginning of the century. Many problems arise from this intensive exploitation, among them deforestation, greenhouse gas emissions, water pollution and even social issues, such as appropriation of native lands.
Considering this globally negative press, we would expect a clear trend in the evolution of the number of products using this calamitous oil. What insights does our database offer on the subject?
The data in the Open Food Facts started being gathered in 2012, which explains this start date of observation. Note how, after a flat behaviour, the palm oil usage noticeably decreased after 2015. For the palm-oil-history padawan, 2015 was a dramatic year of bad press for this type of oil with scandals in France surrounding Nutella, dubbed the
#Nutellagate, and palm oil production clearances linked to
fires in Indonesia.
One could thus expect that products available in France and added during this year would have been more likely to have their palm oil content tagged! "One has to observe something in order to see it". The same explanation can be attributed to the previous years. The decrease following could have several explanation:
- The optimist would conclude in a reduction in the use of palm oil.
- The pessimist (and sadly
realist) would however conclude in a decrease in attention focused on palm oil, the subject going "out of fashion" but the palm trees still growing on freshly cleared exotic forestlands.
But what can we say about the manufacturing countries behind these palm-oil-containing products?
Clearly,
France's neighbours are its
biggest contributors after, obviously, France itself, with the UK heading, followed by Germany, Italy (and its Nutella) and Belgium. Interestingly, the
main palm oil producers (Indonesia, Malaysia, Nigeria, etc.) do not appear in this plot. They clearly do not generate the final product and naturally palm oil is not directly consumed but mostly part of a manufacturing process. As we saw earlier, these manufacturing hubs are mostly in developed countries explaining this distinction.
Palm oil is thus visibly a product imported and manufactured in the developed world. Clearly, developed nations are well equipped to regulate the ecological impact palm oil inflicts on the world.
A Nutritional Dilemna?
The meaning of the nutrition score index we shall be using can be found on the following
page, thanks to
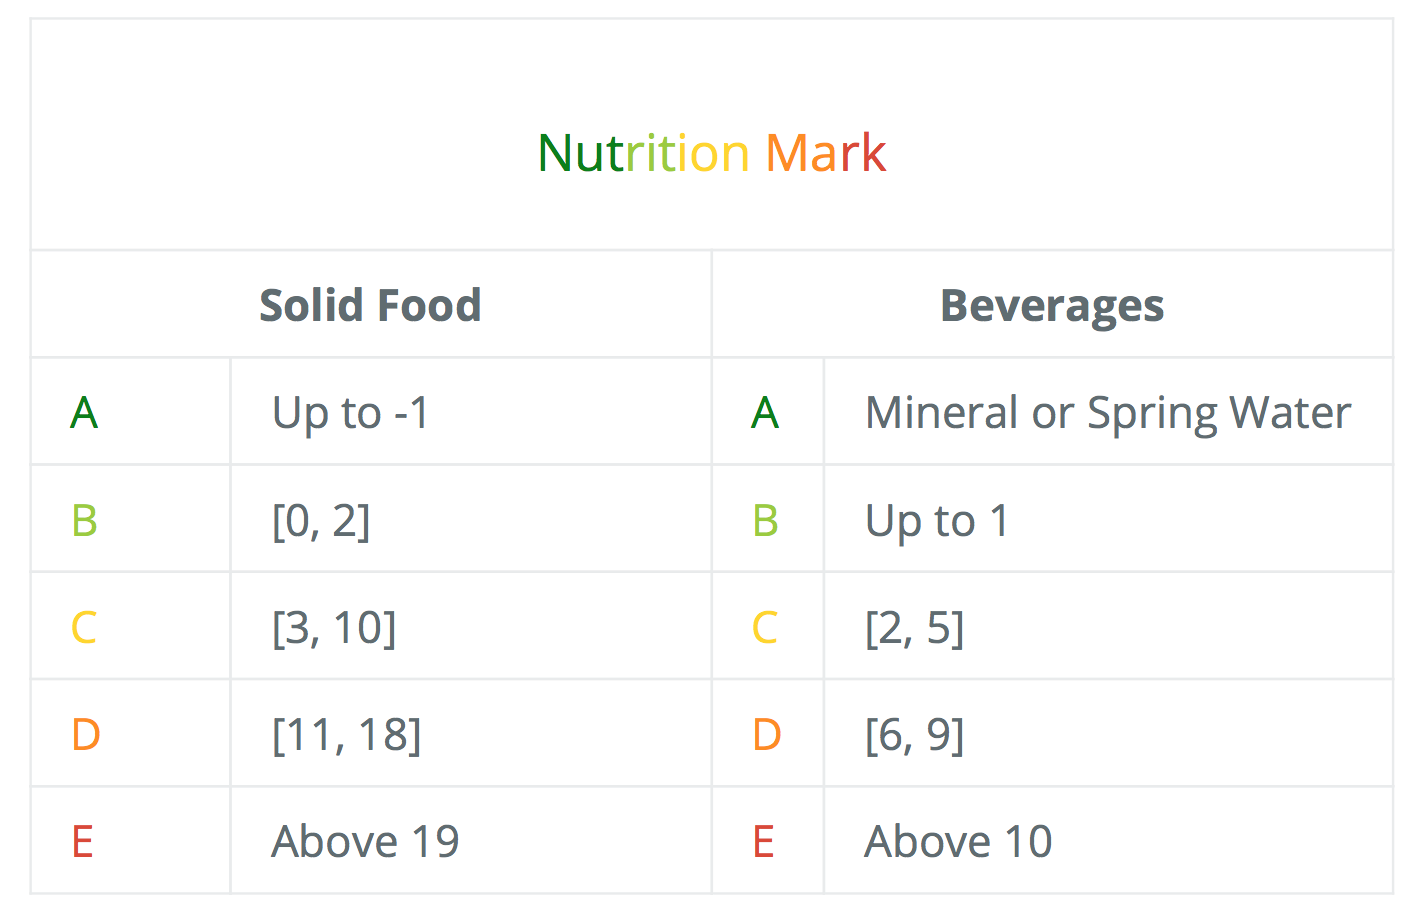
the work of Pr. Serge Hercberg. The main facts are the following:
- Products are marked according to the amount of nutrients they contain [per 100 g] and given a grade between A and E (A being obviously the best mark).
- Whether the product is solid or a beverage, it is assigned a nutrition score accordingly to that displayed on the next table. This score itself is computed in two parts. The first one considers the energy, saturated fat, sugars and sodium. A high level in that category is considered unhealthy. The second part reflects the proportion of fruits, vegetables and nuts, fibres and proteins for which high levels are considered beneficial to the health. The difference of these two parts in the order presented here gives a nutritional scores that is better for low values.
After running a small routine transforming the nutrition score into a nutrition mark, we first query the following histogram, displaying the number of products added per year by mark.
Clearly, a peak in the number of products added with a nutrition grade happened in 2015. However, the behaviour displayed here above matches that of the total number of product added to the database per year. Can we say something about the evolution of the relative weight of each mark through the years?
Yes! Interestingly the levels are overall quite stable. Note however how the two best nutrition mark, A and B, slightly peaked during 2013. In 2018, this trend has reversed and their sum is now even smaller at 29% than in the beginning of the database history, when it was closed to 37%. This decrease has been matched by a similar increase in the less nutritionally favourable products, D and E gaining this 8% difference.
One would therefore be tempted to state there has been a trend towards nutritionally poor products, with the average mark stable. However, it is important at this stage to remember that the dataset does not indicate anything about the popularity of a given product. It merely offers insights into information related to the product itself. Even though more products are added with a poor nutrition mark, it could be that the healthy and less diverse products are in fact more demanded in shops around France than the less ideal ones. The only conclusion to be drawn? More products are added with a bad nutrition mark than a good one. In this respect, food sellers, and of course the government, are the ones who could easily overturn the trend. But who are they?
And unsurprisingly we find the
leaders in the French food retailer market. Now that this trend has been observed, what can we say about the categories of products per mark? How do vegetables, meat, fishery and all fare in the eyes of Pr. Serge Hercberg's team?
Naturally, plant-based products are overwhelmingly the most nutritionally favourable, occupying more than half of the mark A. They, as well as carbs, are less and less prevalent the worse the nutrition mark. On the opposite, sugary snacks are vastly more common in the bad sector of nutrition and become marginal when considering healthier standards.
In the middle ground, dairy, meat and seafood. Surprisingly, what is commonly considered in Europe to constitute the main part of a meal is not the most nutritionally favourable. Meat is indeed well distributed among the different marks but does tend to peak at the lowest values of the nutrition index. Dairy performs slightly better, peaking in the lower part of the middle marks and finally, sea-food in the middle part.
This suggests a different approach to crafting meals and to centre them around plant-based products and carbs in order to embrace a healthier lifestyle. However, we should remember that human motivation is highly correlated to economical criteria. Note however that discussion is harder than it seems: for the same weight, different product may have a different feeding power. Eating a 100g of grapes does not bring the same impact on satiety than a 100g of meat. We shall however not take this point into consideration due to the limit of the information accessible to our curiosity and restrict our investigation to the price per 100g. What can our database offer as insights into the subject?
Amazingly, even though our sample in this respect is very limited, it seems that these efficient nutritional products that plant-based and carbs are also happen to be ... among the cheapest! Even more striking, when considering the distribution regardless of the categories, good nutritional products tend on average to have a lower price than their less performing counterparts! So clearly the choice appears to be simple: what is best for your health seems to be best for your finance! But ... what about the environment?
Let us now investigate the carbon footprint of different products and categories by exploring our modified Open Food Facts dataset. Indeed, the original one, restricted to France, only contained the information for a hundred different products with a heavy bias on their category. To remedy this lack of amplitude, we shall make good use of the Eaternity database sample, provided by Mr. Manuel Klarmann whom we deeply thank again, to enrich our modified version. The approach was to get the direct and parent categories of each product in the Eaternity sample by web scraping, translate them from German to English and then match these with the categories in the Open Food Facts.
Common sense would suggest organic products are rarely manufactured and, due to their origin, inflicting a smaller footprint than the less nutritionally favourable products such as sugary snacks and meat. Let's take a closer look at this. First, what can we say about the categories of the products possessing carbon footprint information?
They unfortunately exhibit a bias towards plant-based products. We shall nonetheless keep it in such proportion since the last section suggested that category to be the most promising one for its nutritional and ecological impact. The category Others gathers products with a category name that did not match our Open Food Fact ones and is discarded in the next part of the analysis.
Let us then observe the relation ship of carbon footprint and price per 100 g. This next plot displays a zoom of our data to make it easier to distinguish between categories.
The two variables do not seem to be closely correlated: there are many inexpensive products with a heavy footprint and vice versa. Note however how clustered the plot is! Products of the same category tend to occupy a certain portion of this phase-space. Observe for example how seafood, meat and dairies occupy the heavy footprint area, sugary snacks cluster (such as chocolate at (200, 2.6)), how carbs, plant-based products and beverages (with tea as a notable outlier) concentrate around the low price low carbon footprint area. This last point is made evident when zooming even more on the origin.
We therefore reach an interesting conclusion: plant-based and carbs-full products are not only better in a nutritional sense, they are also superior in term of ecological impact! Even better: considering our previous section and the first scatter plot, they seem to cost less on average than their meaty/fishy counterparts!
And on this bombshell it is time to end this discussion …
Thank you for following our journey !

Sources:
The Open Food Facts non-profit:
https://world.openfoodfacts.org/
Wikipedia:
https://en.wikipedia.org/wiki/Social_and_environmental_impact_of_palm_oil
https://en.wikipedia.org/wiki/Palm_oil
The Guardian:
https://www.theguardian.com/sustainable-business/gallery/2015/dec/28/palm-oil-nutella-forest-fires-wildlife-deforestation-west-africa-india-2015-gallery
https://www.theguardian.com/environment/2015/jun/17/stop-eating-nutella-and-save-the-forests-urges-french-ecology-minister
Statista:
https://www.statista.com/statistics/263937/vegetable-oils-global-consumption/
https://www.statista.com/statistics/535415/grocery-market-share-france/